

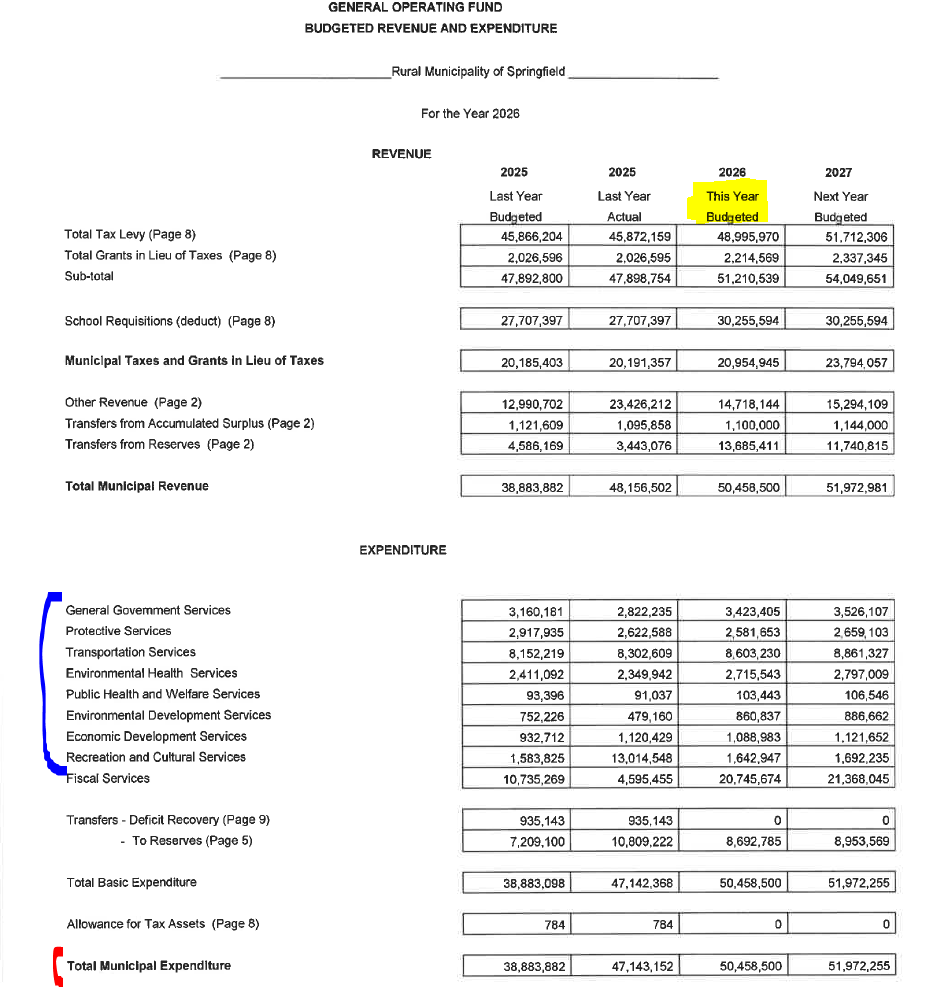
Red Line: The red line indicates the total budgeted expenditures for each year. Source (Financial Plan – 2026, Page 1, with markings): https://rmofspringfield.ca/Home/DownloadDocument?docId=db2c9969-625c-4010-ba79-cdf498798fd2
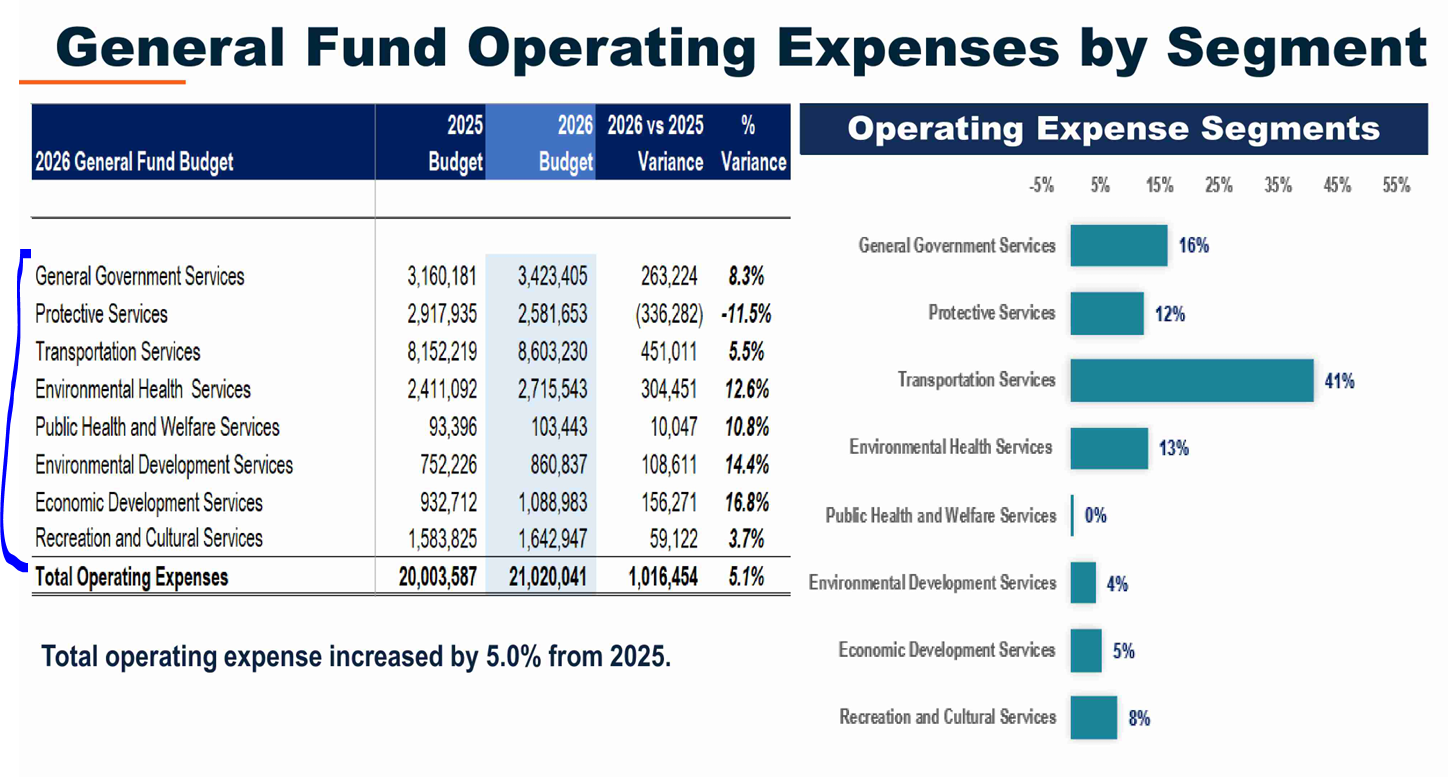
Blue Line: The blue line consists of total budgeted expenses across the eight financial segments for general fund municipal operating expenses for each year (e.g. see Slide 16 of Financial Plan Presentation for 2026): https://rmofspringfield.ca/Home/DownloadDocument?docId=db1f1d06-e8e2-4269-bb92-dada57d31cc4
The chart is based on data manually entered from adopted RM of Springfield Financial Plans, using spreadsheet software. The shown screenshots have markings modifying the original contents, to show corresponding information in red and blue you could calculate for 2026 to check!